Bushfire Risk Management Tools
Welcome to the DFES Bushfire Risk Management analysis tools.
This app has been developed in house by the Metropolitan BRMO's with the assistance of Firefighter Maughan, to assist personnel in BRM Planning with risk assessments and prescribed burn planning.
To get started, open the menu on the left and select one of the asset category assessment tools.
For further information on asset category classifications, please refer to the OBRM Guidelines for Preparing a Bushfire Risk Management Plan.
Should you require assistance, wish to provide feedback or have enhancement requests, please contact the Metro BRMO's at UCL@dfes.wa.gov.au.
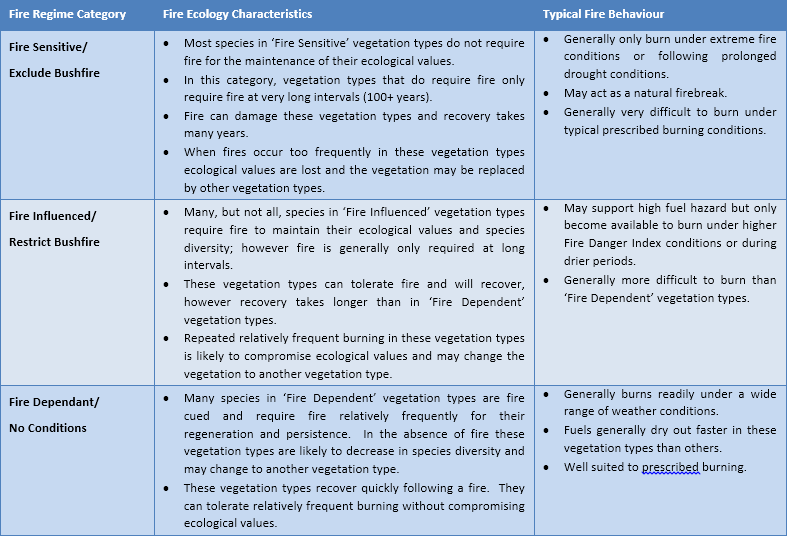
Vegetation Classification
Asset Vulnerability
Level of Impact
Human Settlement Risk Assessment
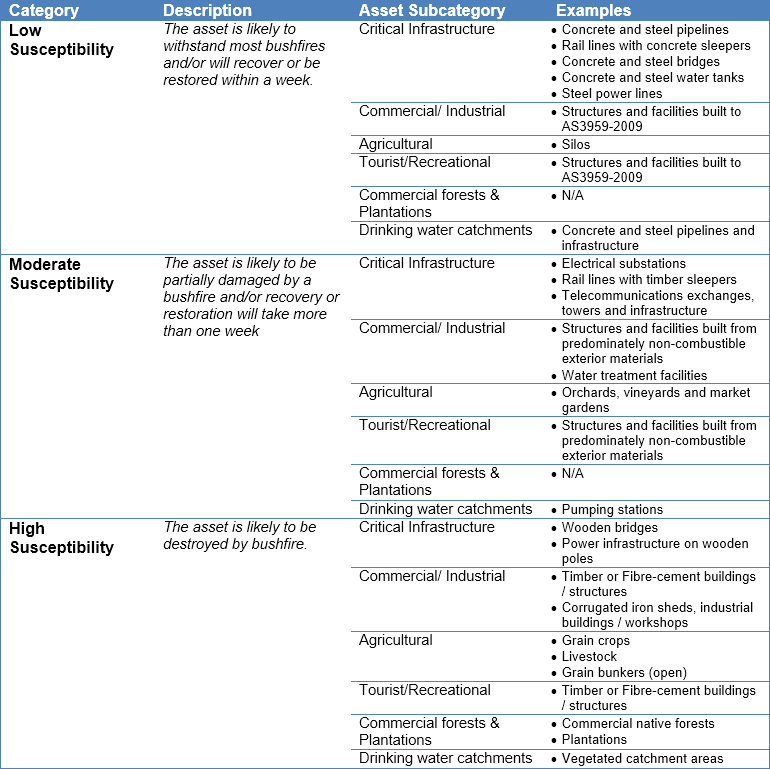
Economic Risk Assessment
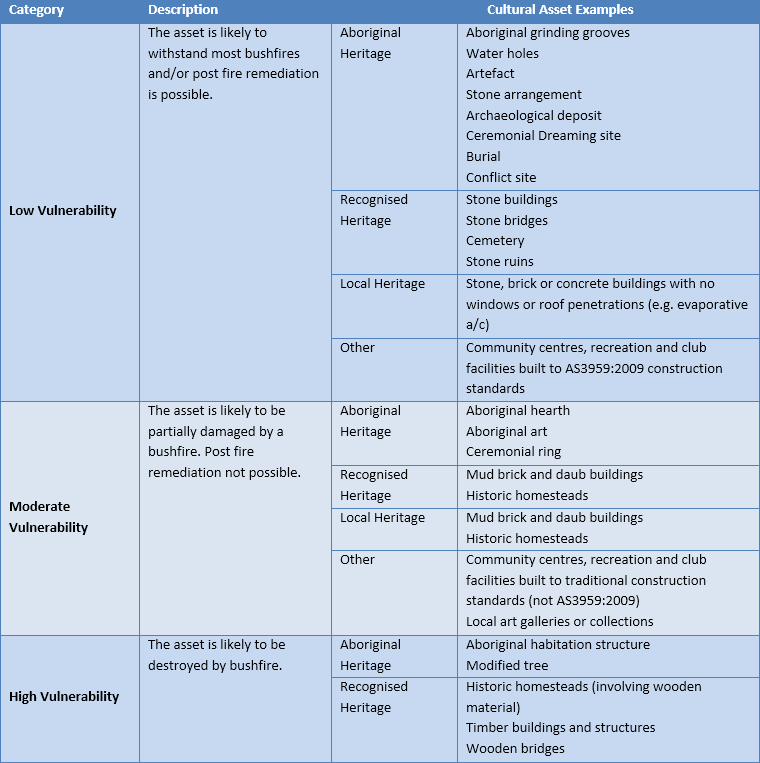
Cultural Risk Assessment
Environmental Risk Assessment
Prescribed Burning
DFES currently provide Fuel Assessment documents which you can download and complete:
- Excel: Fuel Assessment Sheet for Forest Fuels (DEFFM)
- Excel: Red Book Fuel Assessment Spreadsheet
- Word: Prescribed Burn Reconnaissance Form
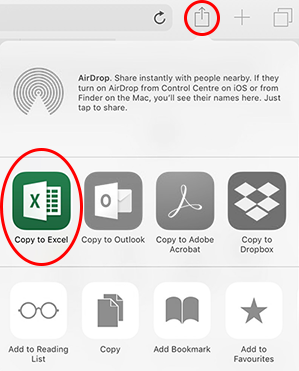
Apple Users
If you are using an iOS Device, you will need to then open the spreadsheet in Excel or Word:
Asset Vulnerability
Potential Impact of Fire
Geographic Extent
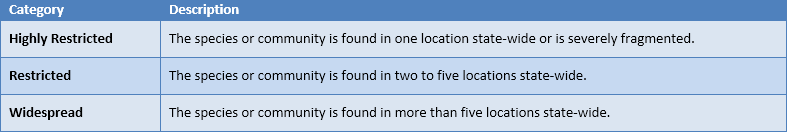
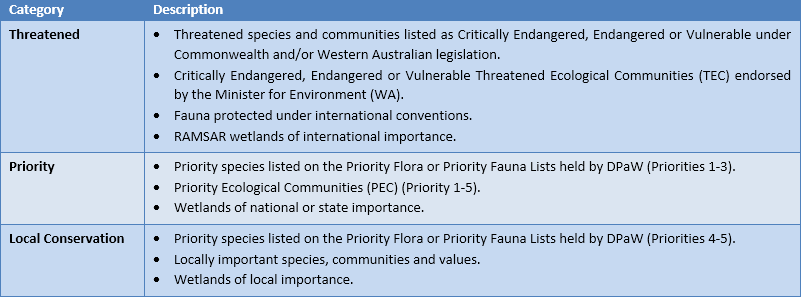
Conservation Status
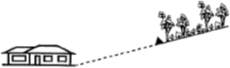
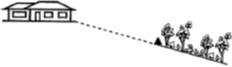
Determine Slope
| Slope from Asset to Vegetation | Slope Under Vegetation | |
 |
Upslope | Upslope |
 |
Flat | Upslope |
 |
Downslope | Upslope |
 |
Upslope | Downslope |
 |
Flat | Downslope |
 |
Downslope | Downslope |
| Degrees | Slope Type | Description of Degrees |
| 0 degrees | Flat Land | No degrees |
| 0 <= x <=5 degrees | Upslope or Downslope | Level ground |
| 5 < x <=10 degrees | Upslope or Downslope | Easy to walk, but cycling is difficult – moderate to walk, too steep for cycling |
| 10 < x <=15 degrees | Upslope or Downslope | Moderate to walk, too steep for cycling – hard climb, limit of 2WD roads |
| 15 < x degrees | Upslope or Downslope | Difficult to climb |
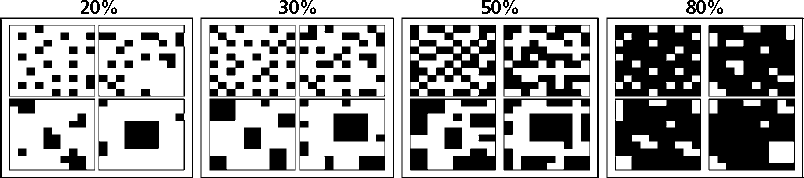
Canopy Cover
If you don't have access to a tool such as a densitometer, the following images can be used to estimate canopy cover when assessing the hazard vegetation.
When standing at the sampling point/s, look directly upwards and compare the average tree canopy viewed to the tile options below, to ascertain the percentage canopy cover.
Some practitioners use a small mirror placed next to the images to reflect the canopy above. This may make it easier to compare the canopy to the image. Each quarter of any one square has the same percentage of cover.
 Alternative tools for determining the canopy cover percentage include the images provided above, or using an app on your phone or tablet, such as Canopy App.


Litter Depth
| Litter Depth (mm) | Forest Type | |||||
| Karri dominant | Mixed M, J, K* | Jarrah dominant | P. pinaster needle | P. radiate needle | Wandoo | |
| Litter weight (tonnes/ha) | ||||||
| 5 | 3.2 | 2.6 | 2.7 | 2.5 | 2.8 | 4.4 |
| 10 | 6.4 | 5.1 | 5.3 | 4.9 | 5.2 | 8.8 |
| 15 | 9.6 | 7.7 | 8.0 | 7.4 | 7.2 | 13.2 |
| 20 | 13.0 | 10.3 | 11.0 | 10.0 | 9.0 | 17.6 |
| 25 | 16.0 | 13.0 | 13.0 | 12.4 | 10.7 | 22.0 |
| 30 | 19.0 | 15.0 | 16.0 | 15.0 | 12.0 | 26.4 |
| 35 | 23.0 | 17.0 | 19.0 | 17.0 | 14.0 | 30.0 |
| 40 | 26.0 | 19.0 | 21.0 | 20.0 | 16.0 | |
| 45 | 29.0 | 22.0 | 24.0 | 22.0 | 18.0 | |
| 50 | 32.0 | 25.0 | 27.0 | 25.0 | 20.0 | |
| 55 | 35.0 | 27.0 | 29.0 | 27.0 | 22.0 | |
| 60 | 39.0 | 29.0 | 24.0 | |||
| 65 | 42.0 | 31.0 | 26.0 | |||
| 70 | 45.0 | 33.0 | 28.0 | |||
| 80 | 51.0 | 37.0 | 31.0 | |||
| 90 | 58.0 | 41.0 | 34.0 | |||
| 100 | 64.0 | 45.0 | 37.0 | |||
Litter Accumulation
| Jarrah Litter | |||||
| No. of years | Canopy Cover % | ||||
| 20 | 40 | 50 | 60 | 80 | |
| 1 | 1.0 | 1.4 | 2.4 | 3.0 | 3.5 |
| 2 | 1.6 | 2.6 | 4.0 | 4.4 | 5.0 |
| 3 | 2.5 | 4.0 | 5.2 | 6.2 | 7.2 |
| 4 | 3.4 | 5.2 | 6.3 | 7.4 | 8.5 |
| 5 | 4.2 | 6.2 | 7.5 | 8.6 | 9.8 |
| 6 | 5.0 | 7.2 | 8.5 | 9.6 | 10.8 |
| 7 | 5.8 | 8.1 | 9.5 | 10.6 | 11.8 |
| 8 | 6.5 | 9.0 | 10.3 | 11.5 | 12.8 |
| 10 | 7.7 | 10.3 | 11.5 | 13.0 | 14.4 |
| 12 | 8.8 | 11.5 | 12.7 | 14.2 | 15.5 |
| 15 | 10.5 | 13.0 | 14.2 | 15.6 | 17.5 |
| 20 | 12.7 | 15.0 | 16.5 | 17.8 | 20.2 |
| 25 | 14.8 | 17.0 | 18.5 | 20.0 | 22.5 |
| Karri Litter | |||||
| No. of years | Canopy Cover % | ||||
| 30 | 50 | 60 | 80 | 100 | |
| 1 | 4.0 | 6.0 | 7.0 | 9.5 | 12.5 |
| 2 | 6.2 | 8.5 | 9.7 | 12.7 | 16.0 |
| 3 | 8.2 | 10.7 | 12.2 | 15.5 | 19.0 |
| 4 | 10.0 | 13.0 | 14.5 | 18.0 | 21.7 |
| 5 | 11.7 | 15.0 | 16.7 | 20.2 | 24.2 |
| 6 | 13.5 | 16.7 | 18.7 | 22.5 | 26.7 |
| 7 | 15.2 | 18.7 | 20.7 | 24.7 | 29.2 |
| 8 | 17.0 | 20.3 | 22.5 | 26.7 | 31.5 |
| 9 | 18.5 | 22.5 | 24.5 | 29.0 | 33.7 |
| 10 | 20.2 | 24.2 | 26.2 | 31.0 | 36.0 |
| 15 | 25.0 | 29.0 | 34.0 | 41.0 | 46.0 |
| 20 | 30.0 | 35.0 | 40.0 | 47.0 | 52.0 |
| 25 | 35.0 | 40.0 | 44.0 | 53.0 | 58.0 |
| Wandoo Litter | ||||
| No. of years | Basal Area (m2/ha) | |||
| 0 - 5 | 5 - 10 | 10 - 15 | 15 + | |
| or Canopy Cover % | ||||
| 20 | 40 | 60 | 80 | |
| 1 | 0.6 | 1.0 | 1.6 | 2.2 |
| 2 | 1.1 | 1.6 | 2.4 | 3.8 |
| 3 | 1.6 | 2.3 | 3.2 | 4.8 |
| 4 | 2.0 | 2.8 | 4.0 | 5.7 |
| 5 | 2.3 | 3.3 | 4.6 | 6.6 |
| 6 | 2.5 | 3.7 | 5.1 | 7.8 |
| 8 | 2.8 | 4.3 | 6.0 | 8.2 |
| 10 | 3.2 | 4.8 | 6.7 | 9.2 |
| 12 | 3.6 | 5.4 | 7.3 | 10.0 |
| 15 | 4.0 | 6.0 | 8.2 | 11.2 |
| 20 | 4.6 | 7.0 | 9.5 | 12.8 |
| 25 | 5.0 | 7.7 | 10.4 | 14.4 |
| 30 | 5.4 | 8.3 | 11.2 | 15.8 |
Asset Susceptibility